Content Analytics is a set of robust capabilities offered by dotCMS to track user interactions across a single site, or different sites if you’re leveraging a multi-site architecture. It records user activity in a site — like the number of times content, pages, or files are accessed — providing valuable insights into customer engagement and content performance. This data helps inform strategic decisions to optimize user experience and maximize impact.
In this tutorial, we’re going to use Analytics to provide a list of the most- and least-popular content in a site. Let’s get started!
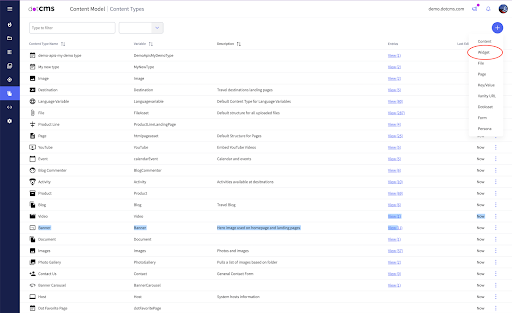
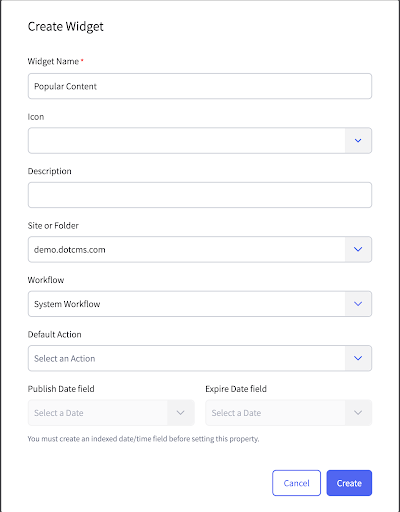
Step 1: Create a New Widget Content Type
Go to Content Types, click the + (plus) button, and choose the Widget option.
Let's call it “Popular Content.”
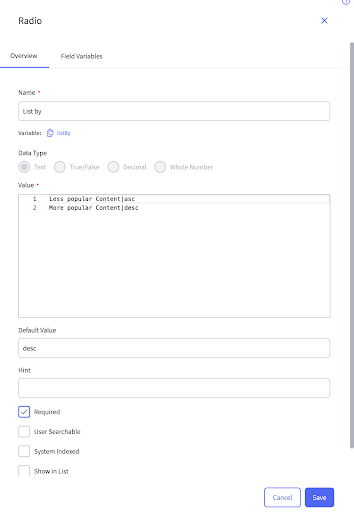
Step 2: Add a Radio Field
You'll see four fields already present. Let's add another:
Add a radio field named “List by”:
Mark it as required.
Set the following values:
Less Popular Content | asc
More Popular Content | desc
Set the default value to desc
Step 3: Add Velocity Code
Edit the Widget Code field and paste the following code:
#if ($filterByContentTypeName)
    #set ($filter = "contentTypeName equals $!filterByContentTypeName")
#else
    #set ($filter = "")
#end

#set($collection = $analytics.runReport("count", "identifier, title",
    "", $filter, "count $listBy", 5, 0).getResults())

<div>
    <h1>$widgetTitle</h1>

    <table class="table-container">
        <thead>
            <tr>
                <th>Identifier</th>
                <th>Title</th>
                <th>Count</th>
            </tr>
        </thead>

        <tbody>
            #foreach($item in $collection)
                <tr>
                    <th>$item.get("request.identifier").get()</th>
                    <th>$item.get("request.title").get()</th>
                    <th>$item.get("request.count").get()</th>
                </tr>
            #end
        </tbody>
    </table>
</div>
Here’s a step-by-step breakdown of what each part of this code sample does:
Filter Setup
#if ($filterByContentTypeName)
    #set ($filter = "contentTypeName equals $!filterByContentTypeName")
#else
    #set ($filter = "")
#end
Checks if filterByContentTypeName is set since it’s not mandatory.
If set, apply the filter "contentTypeName equals $!filterByContentTypeName".
Otherwise, do not apply any filter.
Data Retrieval
#set($collection = $analytics.runReport("count", "identifier, title",
    "", $filter, "count $listBy", 5, 0).getResults())
Retrieves data from Analytics using the runReport method
The runReport method expects seven parameters, which are listed in the section below.
Understanding runReport Parameters
The runReport method requires seven parameters, explained in the table:
Parameter | Description |
|---|---|
Measure | Aggregation method — e.g., count — to calculate the number of hits for each content item. |
Dimension | Fields to retrieve, such as identifier and title. |
Time Dimension | Optional time filter for data retrieval (details to be discussed later). |
Filters | Apply filters using the syntax: field operator value In this case, the filter is "contentTypeName equals $!filterByContentTypeName" to filter content by type. Note: This filter syntax in dotCMS in addition to contentTypeName supports a set of other values like: conHost, contentTypeId, identifier, title, language, persona, etc. dotCMS also supports certain operator values in this filter, such as notEquals, contains, and notContains. |
Order | Field and direction to sort results, using syntax: field direction Example: count desc. Here, $listBy specifies the direction. |
Limit | Number of items to retrieve. In this example, it’s hardcoded to 5, but this value can be dynamic. |
Offset | Starting point for retrieving items, useful for pagination. Here, it’s set to 0 (no offset). |
The final part of the code makes use of the collected data in templated HTML.
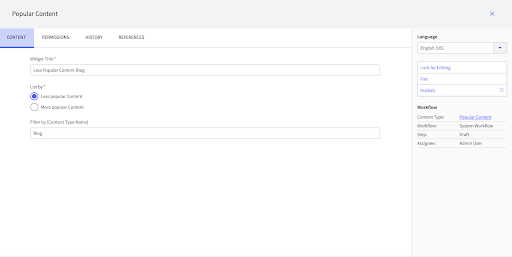
Step 4: Create New Widget Contentlets
Next, we will create a couple of widgets with the following values:
Field | First Widget Contentlet | Second Widget Contentlet |
|---|---|---|
Name: | Less Popular Blog | More Popular Blog |
List by: | Less Popular Content | More Popular Content |
Filter by: | Blog | Blog |
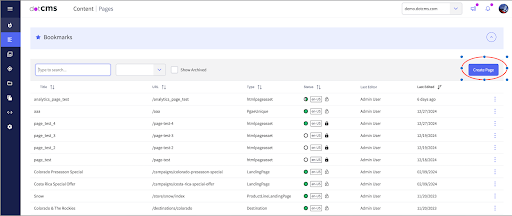
Step 5: Create Page
Go to Pages and click the “Create Page” button to create a new page.
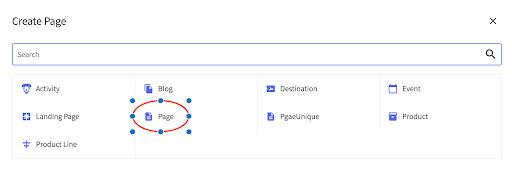
Select “Page” in the dialog:
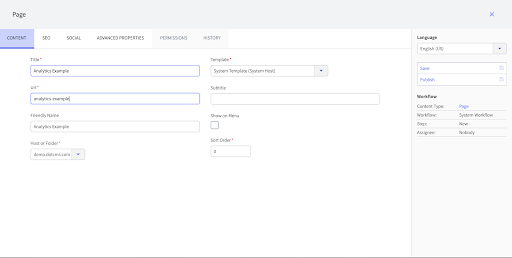
And Create a new Page with the title “Analytics Example,” as appears below:
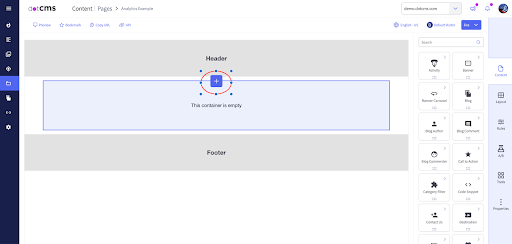
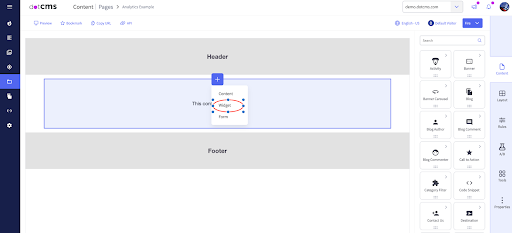
Step 6: Add Widgets to Page
Now add the two newly created contentlets to it.
First, click on the plus button above the container in the Edit Page screen, which will be visible automatically after saving the page.
Select the “Widget” option.
In the “Search Content” dialog, look for the “More Popular Blog” Widget and click on the select button.
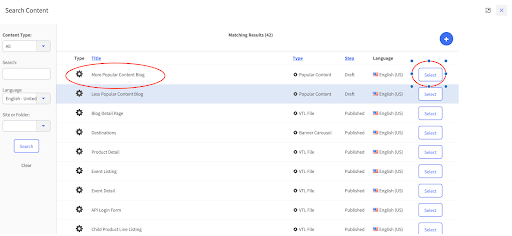
Repeat these steps to the “Less Popular Blog,” and you will see the following:
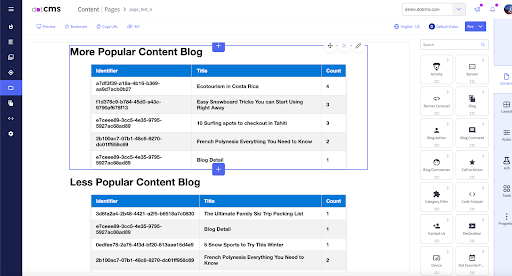
Note on Style
To achieve the styling shown in the picture, you can apply the styling to the widget code as follows:
<style>

.table-container {
    max-width: 800px;
    margin: auto;
    overflow-x: auto;
    background: #fff;
    padding: 10px;
    border-radius: 8px;
    box-shadow: 0 2px 8px rgba(0, 0, 0, 0.1);
}

table {
    width: 100%;
    border-collapse: collapse;
    text-align: left;
    margin-top: 10px;
}

thead {
    background-color: #0078D7;
    color: white;
}

th, td {
    padding: 10px 15px;
    border: 1px solid #ddd;
}

tbody tr:nth-child(even) {
    background-color: #f2f2f2;
}

tbody tr:hover {
    background-color: #f1f8ff;
}

th {
    font-weight: bold;
}

td {
    font-size: 14px;
}
</style>
Using the timeDimensions Parameter in the runReport Method
Remember the timeDimensions parameter from the runReport method? We’ll now use it to make our example more engaging, allowing us to apply a date range and time granularity to our example.
Step 1: Add New Fields to the “Popular Content” Content Type
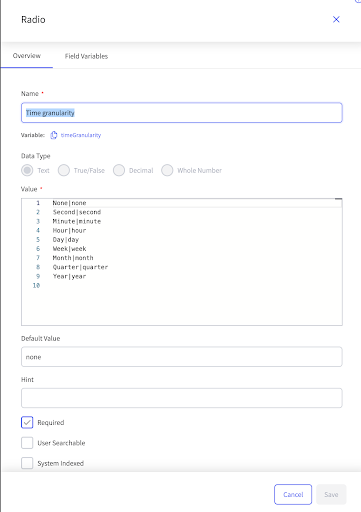
Add a "Time Granularity" Field:
Type: Required Radio Field
Options:
None|none
Second|second
Minute|minute
Hour|hour
Day|day
Week|week
Month|month
Quarter|quarter
Year|year
Refer to the picture below to see how it looks.
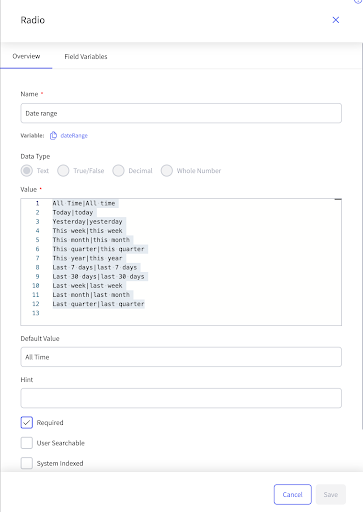
Add a "Date Range" Field:
Type: Required Radio Field
Options
All Time|All time
Today|today
Yesterday|yesterday
This week|this week
This month|this month
This quarter|this quarter
This year|this year
Last 7 days|last 7 days
Last 30 days|last 30 days
Last week|last week
Last month|last month
Last quarter|last quarter
Refer to the screenshot below to see how it looks.
Step 2: Update the Widget Code
Finally, incorporate the required changes in the Widget Code to utilize the new fields effectively.
#if ($filterByContentTypeName)
    #set ($filter = "contentTypeName equals $!filterByContentTypeName")
#else
    #set ($filter = "")
#end

#if ($timeGranularity != 'none')
    #set ($timeGranularityValue = $timeGranularity)
#else
    #set ($timeGranularityValue = "")
#end

#if ($dateRange != 'All time')
    #set ($dateRangeValue = $dateRange)
#else
    #set ($dateRangeValue = "")
#end

#if ($timeGranularityValue != '' || $dateRangeValue != '')
    #set ($timeDimensions = "request.createdAt,$!timeGranularityValue:$!dateRangeValue")
#else
    #set ($timeDimensions = "")
#end

#set($collection = $analytics.runReport("count", "identifier, title",
    $timeDimensions, $filter, "count $listBy", 5, 0).getResults())


<div>
    <h1>$widgetTitle</h1>

    <table class="table-container">
        <thead>
            <tr>
                <th>Identifier</th>
                <th>Title</th>
                <th>Count</th>

                #if ($timeGranularityValue != '')
                    <th>$timeGranularityValue</th>
                #end
            </tr>
        </thead>

        <tbody>
            #foreach($item in $collection)
                <tr>
                    <th>$item.get("request.identifier").get()</th>
                    <th>$item.get("request.title").get()</th>
                    <th>$item.get("request.count").get()</th>

                    #if ($timeGranularityValue != '')
           <th>$item.get("request.createdAt.$timeGranularityValue").get()</th>
                    #end
                </tr>
            #end
        </tbody>
    </table>
</div>
Conclusion
Content Analytics is a powerful feature that helps you adjust your site's behavior based on user activity. For example, in this blog, we display a list of blog posts ranked by user interest.
You can also use Analytics to monitor your site and see if a specific page or section is getting the attention you expect. With this data, you can decide whether to create an experiment to test and determine the best changes to improve user engagement.
Full official documentation of this feature will be coming soon — it really is a brand new feature. But we will be publishing another post in the near future with further examples. Stay tuned!